Showing posts with label new home sales. Show all posts

Tuesday, November 8, 2016

National Housing Data

Housing Data

  • Existing Home Sales (closed deals in Sep) rose 3.2% to an annual seasonally adjusted pace of 5,470,000 units. Single Family sales rose 4.1% to 4,860,000 with a median price of $235,700 - up 5.6% in the last year. Condo sales actually fell 3.2% to 610,000 units with a median price of $222,100, which is up 6.1% from a year ago. Who's buying - 34% 1st time buyers, 21% cash buyers, and 14% investors (65% paid cash). Average time on the market is 39 days with a 4.5 month supply of homes for sale.
  • Pending Home Sales Index (signed contracts in Sep) rose 1.5% (1.2 expected) to 110.0. The West region was up 4.7%, South up 1.9%, Midwest down 0.2%, and Northeast down 1.9%.
  • New Home Sales (signed contracts in Sep) rose 3.1% to a seasonally adjusted annual pace of 593,000 units in September. The median price of a new single family home is now $313,500 with a mean price of $377,700. There are now 235,000 new homes for sale.
  • Housing Starts (excavation began in Sep) plunged 9.0% to a seasonally adjusted annual rate of 1,050,000 units. Multi-family Starts (5 units or more) fell a whopping 39% to 250,000 units per year. The good news is that Single Family Starts rose 8.1% to 783,000 units. Builders typically hurry to pour foundations before the cold winter months and in preparation for the Spring buying season.
  • Building permits rose 6.3% to a seasonally adjusted rate of 1,225,000 units. Single Family Permits increased 0.4% to an annual rate of 739,000 units. Multi Family Permits rose 17.2% to 449,000 units per year.
  • Remember that New Home Sales, Housing Starts, and Building Permits, are notoriously volatile and are exacerbated by the constant revisions and changes to the seasonal adjustment formula. These numbers typically have a high degree of statistical uncertainty.
  • The S&P CoreLogic Case Shiller 20 City Composite HPI rose 0.24% in August (as expected) and 5.1% for the last 12 months. Price increases were led by Portland, Seattle, and Denver.
  • The FHFA Home Price Index rose 0.7% in August (0.4% expected) and 6.4% for the last 12 months.

  • With this latest increase, the estimated value of homes in America is about $22 Trillion - that's $22,000,000,000,000. Generally, homeowners like rising home prices as it increases wealth but it also creates problems for home buyers. Buyers are frustrated with low inventory and the choices of affordable homes - or worse - being priced out of the market completely.
Happy Investing!

Today's blog courtesy of Cheryl Taylor, American Pacific Lending

Tuesday, May 10, 2016

Housing Stats


Single-Family Home Sales Maintain Momentum; New Homebuilders Strive to Keep Pace

May 6, 2016
  • Housing demand remains elevated as low mortgage rates have helped keep the cost of ownership in check despite steady appreciation. The solid pace of hiring over the last six years and modest but consistent wage growth have helped prospective homeowners repair their balance sheets and re-engage the housing market. One major hurdle homebuyers face, however, is the limited availability of homes for sale in many markets. Although housing construction has stepped up in the last year, homebuilders have been slow to add inventory — particularly in the entry-level category. As a result, the limited supply of available homes has sharply curtailed first-time homebuyers in particular.
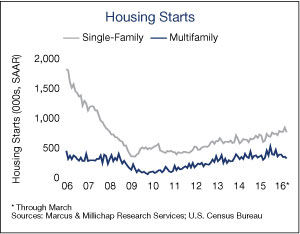
  • Builders boosted their pace of construction by 14 percent as of March, putting them on track to complete 1.1 million annualized units of housing. Single-family housing starts rose 23 percent as builders sought to leverage positive consumer outlooks and improving mortgage availability. The level of single-family building remains roughly three-fourths of the long-term average, however, and efforts to raise production to the historical norm remain hampered by a shortage of labor in residential specialty construction trades. These establishments hired 135,000 workers over the past year and the migration of workers from oil-and-gas regions could provide additional staffing.
  • Home purchases of previously owned single-family residences rose approximately 3.0 percent over the 12 months ending in March, while the median price advanced 6.0 percent to $232,000, putting it on par with prerecession peak pricing on a national level. Mortgage applications for purchase also continue to rise, signaling higher sales volume in the coming months. New-home sales, meanwhile, jumped 5.5 percent year over year, and inventory remains tight.
  • Although 2016 apartment completions will reach their highest level since the 1980s, multifamily housing starts, encompassing both for-sale units and rentals, fell during the 12 months ending in March with permits also declining. One reason the pipeline is thinning is because lenders remain quite cautious and have tightened construction lending, particularly as Class A vacancy rates creep upward toward 6.0 percent this year. Developers will complete 285,000 rentals this year, with roughly one-third concentrated in a group of five markets, including New York City and Washington, D.C. Elevated completions will contribute to a nominal rise in U.S. apartment vacancy to 4.2 percent in 2016.
Happy Investing!

Today's blog courtesy of Marcus and Millichap Research Blog

Thursday, April 23, 2015

New Home Sales

New Home Sales were up in February. Will sales heat up even further this spring and summer? 

What is the New Home Sales report? The New Home Sales report shows the number of newly constructed homes with a committed sale during the month. The level of new home sales indicates housing market trends, and the volume of sales indicates housing demand. Also, the monthly supply of homes serves as an input into the level of housing pressure. 

What's happened recently? New Home Sales hit a seven-year high in February, rising 8 percent from January to an annual rate of 539,000 units, while January's sales were revised higher to 500,000. New Home Sales now stand at their best level since February 2008 and are up nearly 25 percent from the 432,000 recorded in February 2014. 

What's the bottom line? While pricing and sales for new homes were up, the Existing Home Sales report was not as promising, due in part to winter weather and low inventory. It remains to be seen if spring and summer will be strong seasons for the housing sector, but these early numbers for new homes sound another promising note in the recovery. 

Nevertheless, home prices are continuing to show signs of growth, as the S&P/Case-Shiller Home Price Index rose by 4.6 percent from January 2014 to January 2015. This is the biggest gain since September and up from the 4.4 percent annual rate recorded in December. The lofty price gains seen in 2013 and early 2014 may have cooled, but home price gains continue to be steady at what is considered normal levels. 

The bottom line is home loan rates continue to remain very attractive, making now a great time to consider a home purchase.

Happy Investing!


Today's blog courtesy of Steve Bighaus, Security National Mortgage Company

Friday, July 11, 2014

Home Sales Climbing Nationwide

   The National Association of REALTORS® reported that Existing Home Sales were up 4.9 percent from May to April, reaching an annual rate of 4.89 million units. That's the highest monthly rate since the 5.5 percent recorded in August 2011. Existing Home Sales is a measure of the selling rate of pre-owned, single-family homes, which accounts for over 80 percent of all houses sold. 

New Home Sales, which tracks never before occupied homes, challenged the analysts by rising to a 6-year high in May. According to the U.S. Census Bureau, 504,000 new homes were sold. This was an 18.6 percent increase over April, marking the largest single-month increase in 22 years! 

And according to the S&P/Case-Shiller Home Price Index—which measures changes in values between sales and is compiled into an index for select U.S. cities—all 20 tracked markets climbed nationwide in April. 

What's the bottom line? While the supply of homes for sale has dwindled to an 11-month low overall, prices are going up, albeit at a much slower pace than in 2013. It remains to be seen whether the housing market will continue to expand through the remainder of the summer, but it's clear that great deals are here today.